[참고 URL]
ignite.apache.org/docs/latest/monitoring-metrics/tracing
Tracing | Ignite Documentation
When you start your cluster with the above configuration, Ignite does not collect traces. You have to enable trace sampling for a specific API at runtime. You can turn trace sampling on and off at will, for example, only for the period when you are trouble
ignite.apache.org
Apache Ignite, Gridgain을 사용하면서 들어오는 SQL 쿼리 또는 API통신에 대한 분산(GRID) 추적을 위한 Tracing이 필요하다. OpenCensus, Zipkin 같은 오픈소스를 활용하여 Tracing처리를 하는 것도 가능한 것 같다. (시도해 봤으나 잘 모르겠음.)
Gridgain에서 이를 위한 도구를 제공하는데, 그것이 바로 Control Center다. grafana 짬뽕해놓은 듯 어설프지만 최근에 릴리스하였고, 이것저것 쓸모가 있을 듯하다. 근데 웹 콘솔에서 제공하지 않는 Tracing을 여기서 할 수 있다.

[방법]
1. 다운로드한 프로젝트에서 server.xml에 Tracing Configuration을 추가해준다.
기본 프로젝트에는 discoverySpi, dataStrorageConfiguration, cacheConfiguration 3가지만 property에 들어가 있고, 아래 tracingSpi를 추가해준다.
<bean class="org.apache.ignite.configuration.IgniteConfiguration">

    <property name="tracingSpi">
        <bean class="org.apache.ignite.spi.tracing.opencensus.OpenCensusTracingSpi"/>
    </property>

</bean>
그리고 Maven 빌드하여 jar파일과 xml을 클러스터 노드 전체에 올려주어야 한다.
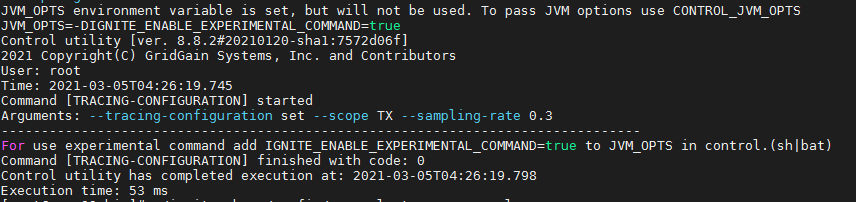
2. Apache Ignite/Gridgain의 설치경로 /bin 위치에서 아래 명령어를 입력하여, Tracing Configuration을 활성화한다.
sampling-rate는 0부터 1까지 설정하여 샘플링 속도를 조절한다. 0은 샘플링을 하지 않는 것이고, 1은 계속 샘플링을 수행하는 것!
JVM_OPTS="-DIGNITE_ENABLE_EXPERIMENTAL_COMMAND=true" ./control.sh --tracing-configuration set --scope TX --sampling-rate 0.3
3. 이제 ignist.sh를 실행하여 클러스터가 정상적으로 실행되는지 확인한다.
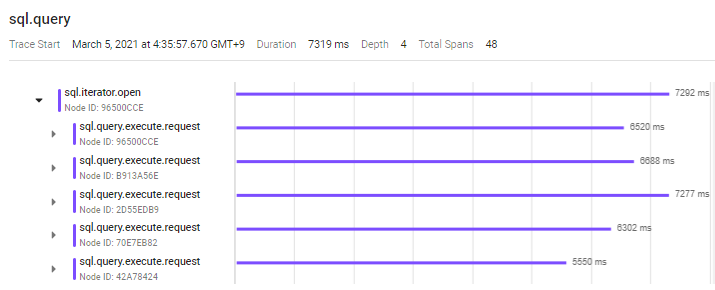
4. 클러스터가 기동 되면서 Gridgain Control Center URL(with Token)으로 접속하여 Tracing 설정을 확인한다.
단일 SQL 쿼리에 대한 추적을 확인할 수 있으며, 분산 처리된 노드 별 응답속도를 확인할 수 있다.

* Control center는 Gridgain 홈페이지를 참고하면 쉽게 설정할 수 있다.
'Ignite > Apache Ignite' 카테고리의 다른 글
| [미공개] Apache Ignite | RestAPI Sample (0) | 2021.04.13 |
|---|---|
| [Gridgain] DBeaver를 통한 Apache Ignite/Gridgain 클라이언트 연결 (0) | 2021.01.21 |

댓글